

Powerful Single Node RKE2 on Hetzner for CHEAP! (Part 2)
Single-Node Kubernetes Series
- Powerful Single Node RKE2 on Hetzner for CHEAP! (Part 1)
- Powerful Single Node K3S on Hetzner for CHEAP! (Part 1a)
- Powerful Single Node K3s on Hetzner for CHEAP! (Part 2)
RKE2 Install
In the first blog of this series, we deployed a single node RKE2 deployment and Rancher UI or a cheap Hetzner server.
In this post, we will install the following:
- Longhorn for Persistent Data
- Rancher Monitoring
- EFK Logging (Elasticsearch,Fluent Bit,Kibana)
What is Longhorn
Longhorn is an official CNCF project that delivers a powerful cloud-native distributed storage platform for Kubernetes that can run anywhere. When combined with Rancher, Longhorn makes the deployment of highly-available, persistent, block storage in your Kubernetes environment easy, fast, and reliable.
Some of the key features are:
- An Inuitive Dashboard
- Easy 1-Click Deployment
- Built in Disaster Recovery Tools
- Infrastructure Agnostic means it run on any Kubernetes, anywhere
- A CNCF Sandbox Project
Installing Longhorn
Official Longhorn Documentation
As noted in the features above, the install of Longhorn has really been simplified using the one-click installer in the Rancher UI “apps” section. Follow the instructions below to get started:
- In Rancher MCM, Navigate to the cluster where you will install Longhorn.
- Navigate to the
Apps & Marketplace,Chartsmenu item. - Find the
Longhornitem in the charts and click it. - Click
Install. - Customize the default settings by selecting
Customize Helm options before installbox. - Under
Longhorn Storage Class Settingschange theDefault Storage Class Replica Countfrom3to1. This is because we are running a single server and Longhorn by default expects 3 separate servers with 3 copies of the data for redundancy. In an actual production cluster, you can leave this at 3. - Click
NextandInstalland Longhorn will install on RKE2.
Notes
- You may want to add additional volumes specifically for Longhorn. To do that, add a volume, format at EXT4 or XFS, and mount it on your host/s. Then you can point to that path in the Longhorn config. In this case, we are just using the additional space on the root volume of the disk as longhorn automaticall mounts to
/var/lib/longhorn. - You may need to install
iscsi-initiator-utilson your system for Longhorn to install properly.
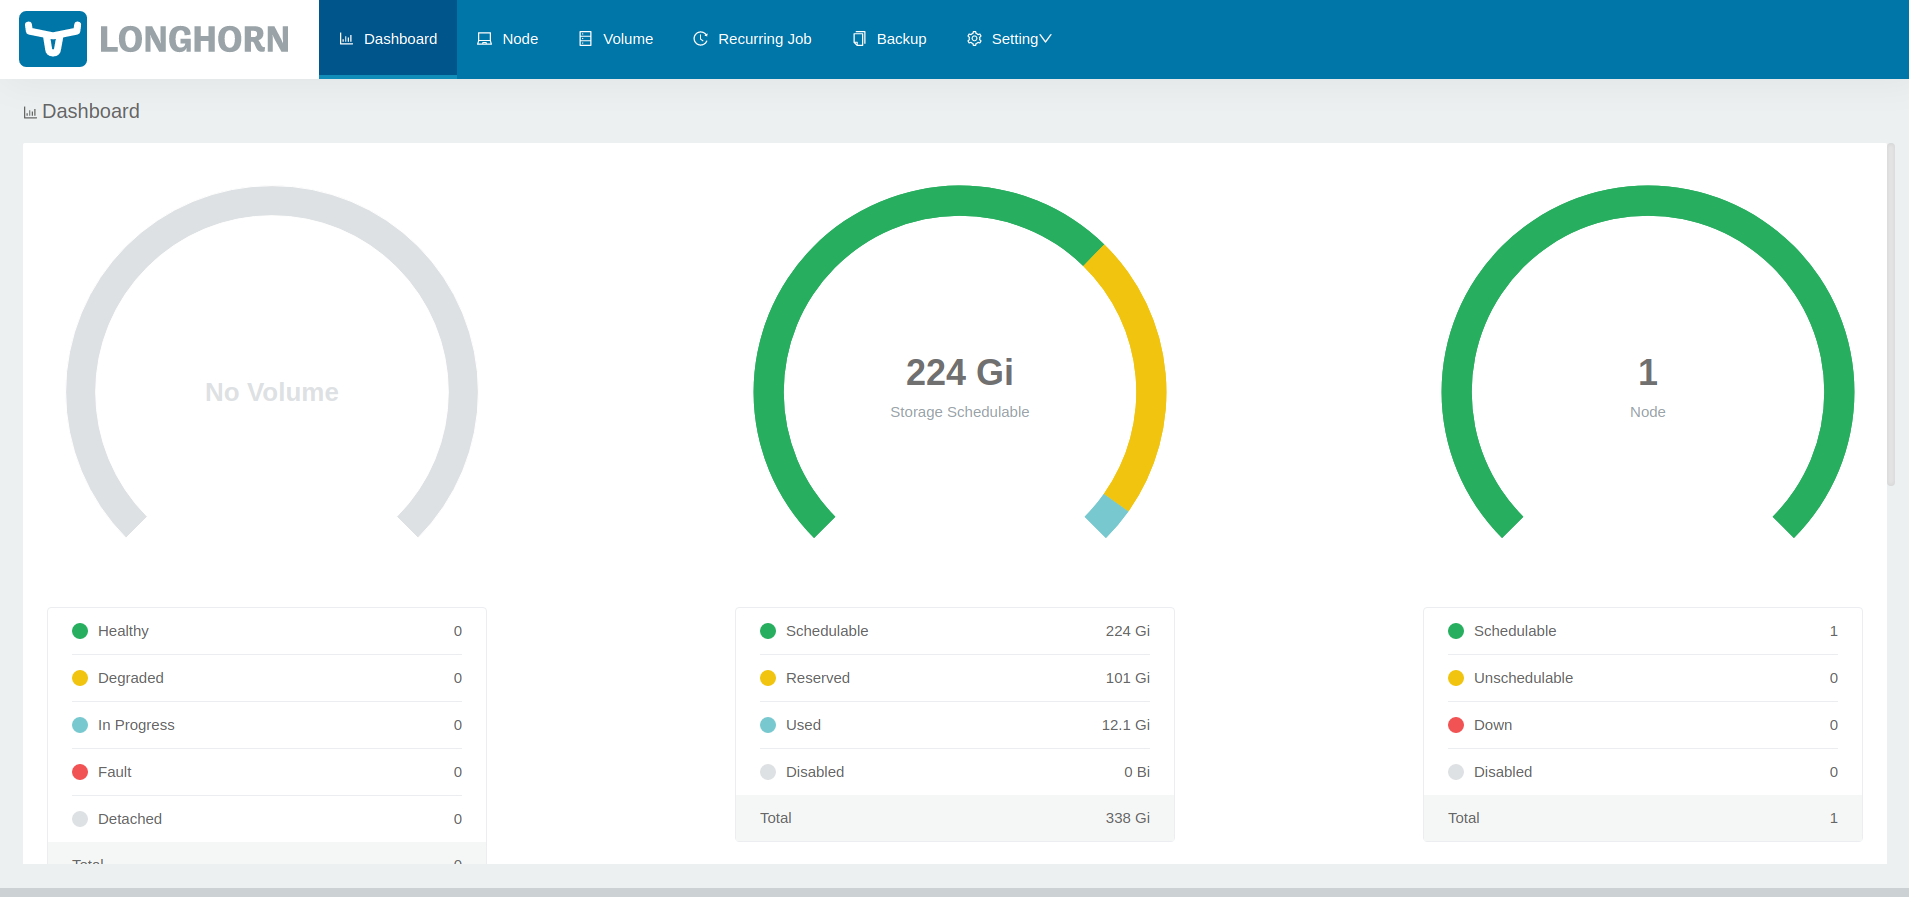
Accessing Longhorn
Now that Longhorn is installed, we can access the Longhorn UI via the Rancher UI.
- In Rancher MCM, Navigate to the cluster where installed Longhorn.
- Navigate to the
Longhornmenu item. - Click
Manage storage system via UIon the Longhorn card and a new window will open with your Longhorn UI showing.
Installing Monitoring
Now that we have Longhorn installed for Persistent Storage, we can install Monitoring with persistence. The Rancher Monitoring chart will install Prometheus, Grafana, Alert-Manager and other tools to monitor the cluster.
- Login to the Rancher UI.
- Go to
Apps and Marketplace,Charts. - Click on
Monitoringmenu item and clickInstall. - Leave the version as the default, but select
Customize Helm Options before Installat the bottom of the page. ClickNext. - Under Prometheus (on the inner left column), change the following options:
- Retention Size:
10GiB - CPU Limit:
1500m - Memory Limit
2048Mi - Select the box for
Persistent Storage for Prometheus. - Size:
10Gi - Storage Class Name:
longhorn
- Retention Size:
- Under Grafana (on the inner left column), change the following options:
- Select
Enable with PVC Template - Size:
10Gi - Storage Class Name:
longhorn - AccessMode:
ReadWriteOnce
- Select
- Click
Next, then clickInstall.
Once this is complete, you should now have access to monitoring for your node and workloads running in your cluster.
Accessing Monitoring
Monitoring is complex, especially when it comes to alert configuration..
To get you started, we will show you 2 ways to see what is being monitored and your cluster stats.
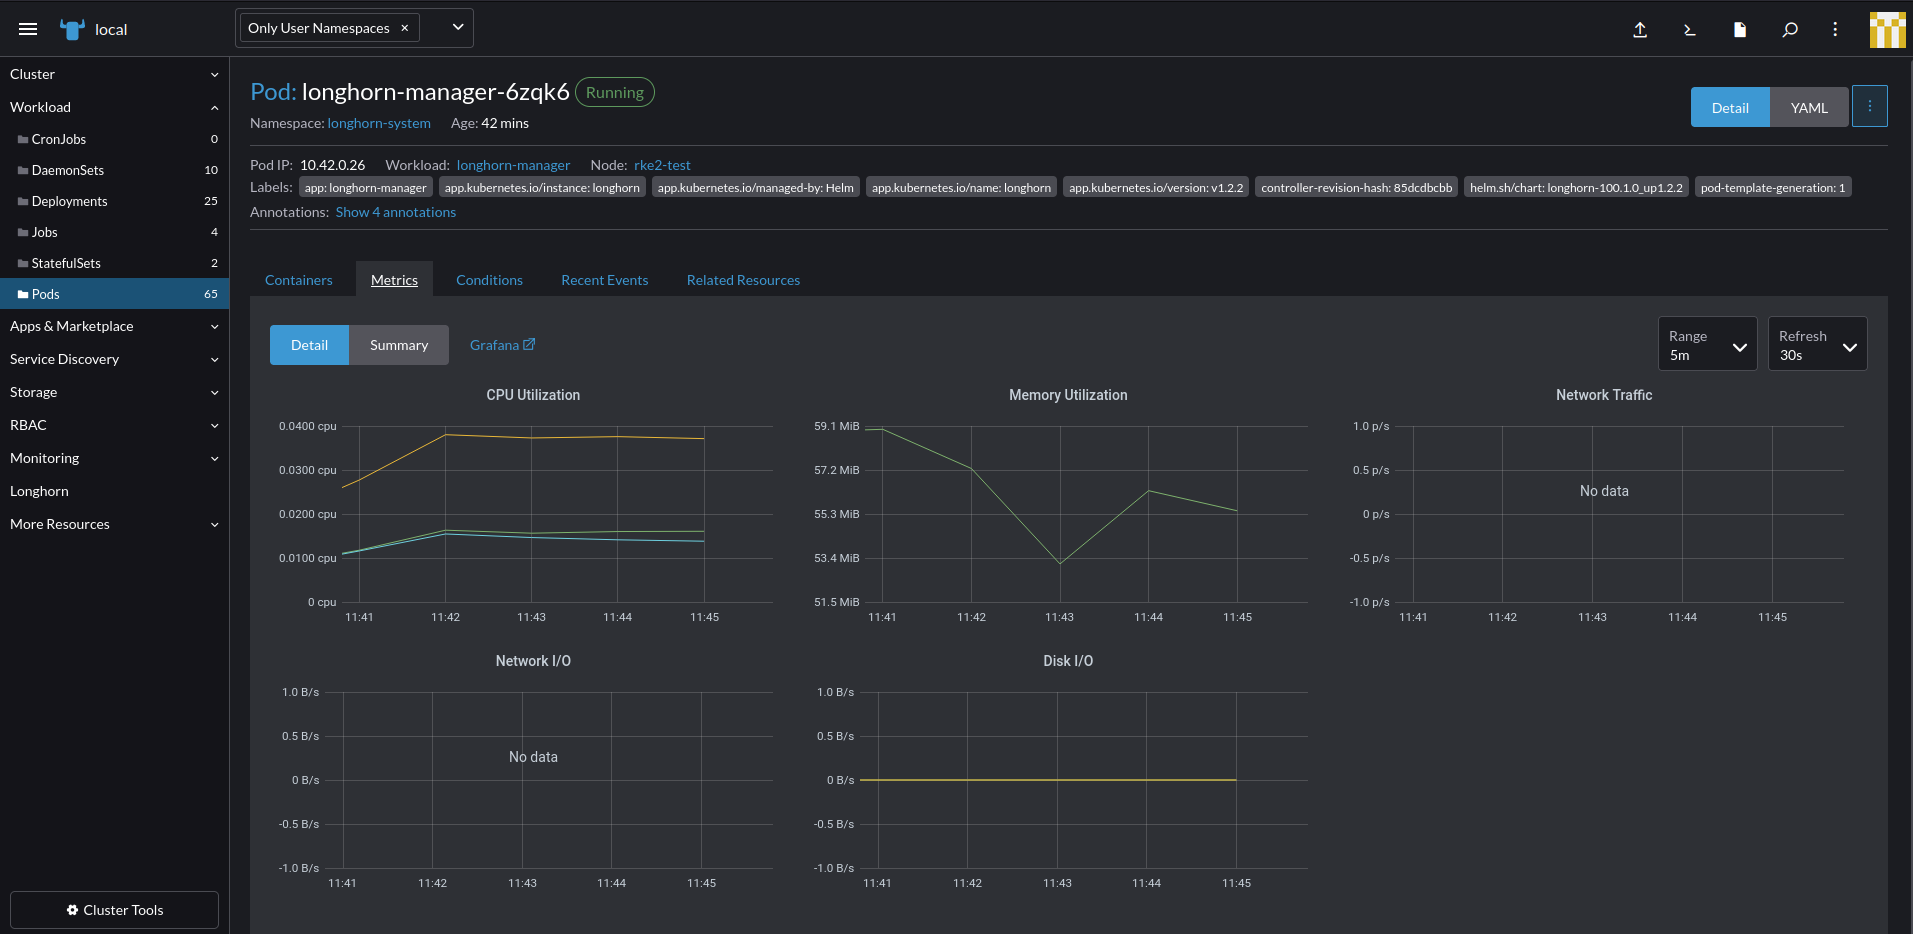
Via the Workloads
- In the Rancher UI, click on
Workload,Pods. - Click on a workload name like
longhorn-manager-010101and then click on Metrics. - You can see the different metrics for that specific Pod and change the time scale you ae see it in.
- You can also click on
Grafanato be taken to the full Granfana dashboard for those specific metrics.
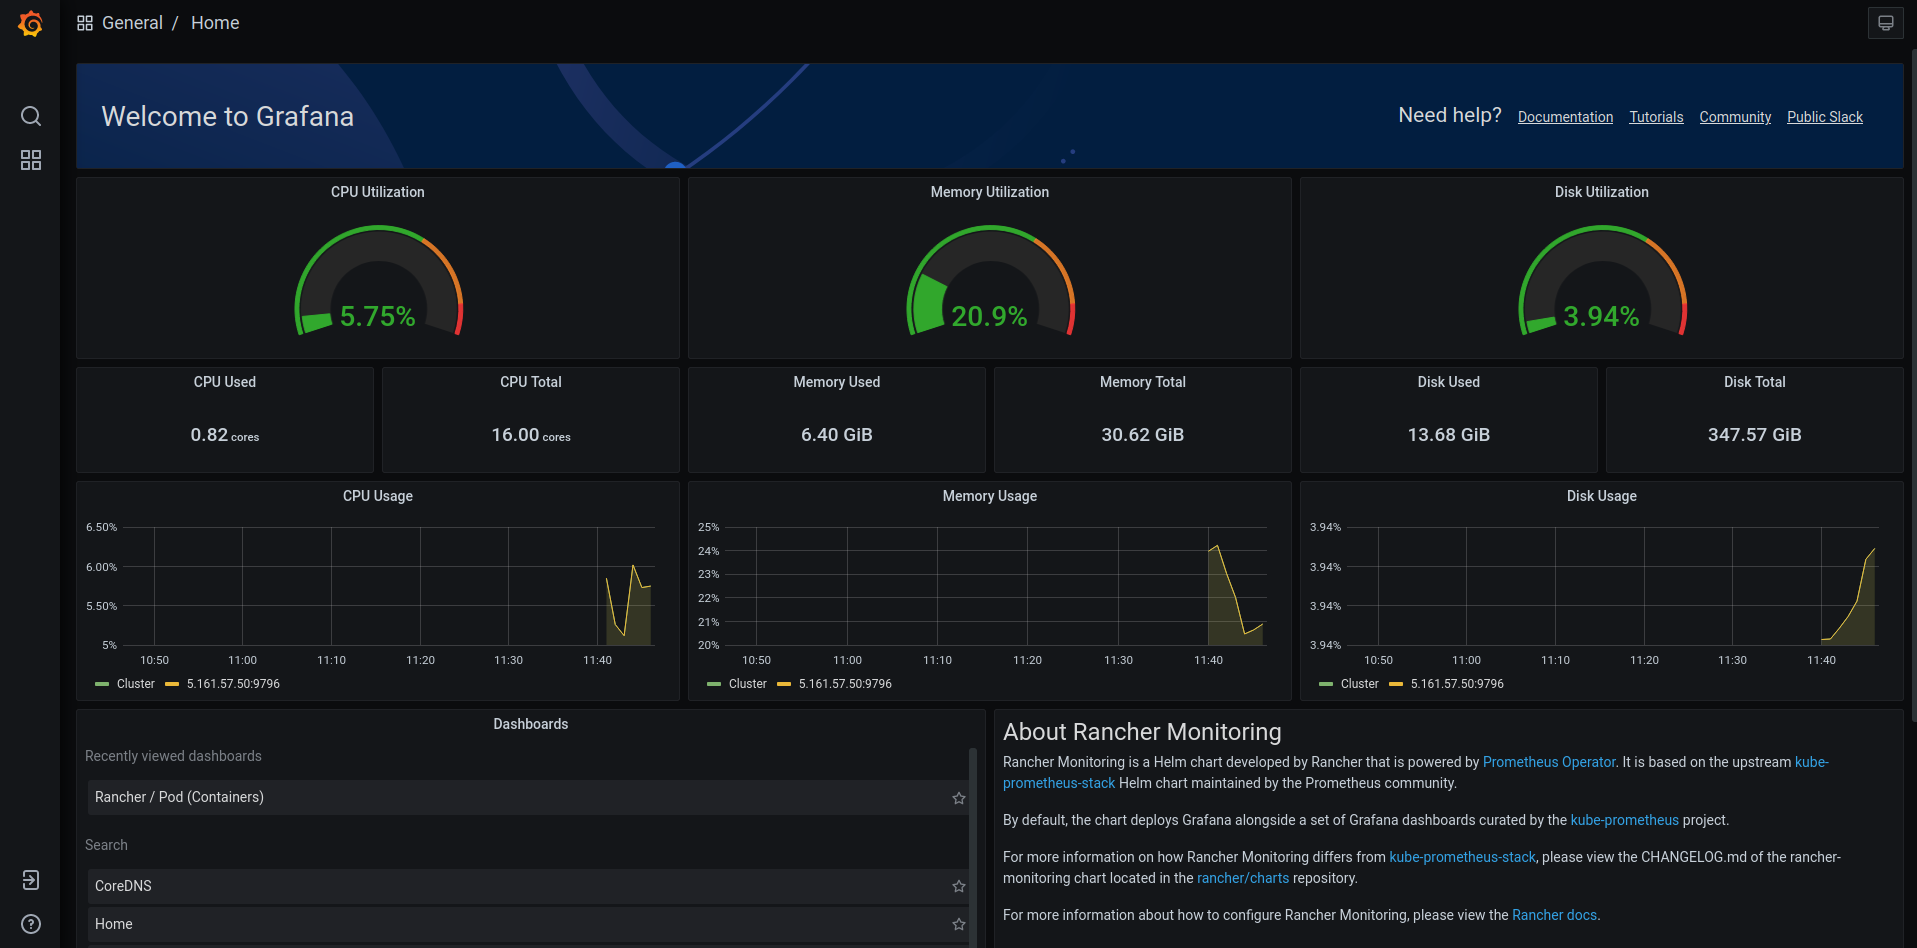
Via Grafana
- In the Rancher UI, click on
Monitoringin the menu. - Under
Grafana, click onMetrics Dashboard. This will open a new tab for Grafana - The Welcome screen shows stats for the cluster as a whole.
- To explore the cluster more, hover on the 4 boxes in the menu and click
Manage. This will show you an entire list of metrics you can drill down into and view.
Installing Logging
Logging is a large scale endeavor in itself. Make sure you understand the needs of your organization and whether or not you should log to a hosted service (we like LogDNA). However, in many cases, sending logs externally is not an option.
In today’s example, we will deploy Elasticsearch locally to ingest the logs, Kibana to view them, and Fluent-bit to ship them from the containers to Elastic.
Installing Elasticsearch
For Elasticsearch and Kibana, we will use the Helm charts maintained by Bitnami, a VMWare entity. They are very well maintained and well documented and are well suited for this application.
- Login to the Rancher Interface.
- Go to
Apps and Marketplace,Repositories. - Click
Createand add the following then clickCreateagain.
- Name:
bitnami - Index URL:
https://charts.bitnami.com/bitnami
- Under
Cluster, clickProjects/Namespaces. - Under the
Defaultproject, clickCreate Namespaceand name itlogging-system. - Go to
Apps and Marketplace,Charts. - Select only
bitnamifrom the chart repo options. - Click on
elasticsearchmenu item and clickInstall. - Update the following and click
Next:- Namespace:
logging-system - Name:
elasticsearch-logging - Customize Helm options before install:
check.
- Namespace:
- Replace all the YAML with the below code.
- In the below code, update the
elasticPassword:with your desired password. Make this complex because it is complicated to change. Save this password as it will be required for Kibana and Fluent.
YAML in each section to expand the code.clusterDomain: cluster.local
config: {}
coordinating:
affinity: {}
autoscaling:
enabled: false
maxReplicas: 3
minReplicas: 1
targetCPU: ''
targetMemory: ''
customLivenessProbe: {}
customReadinessProbe: {}
customStartupProbe: {}
fullnameOverride: ''
heapSize: 128m
hostAliases: []
initContainers: []
livenessProbe:
enabled: true
failureThreshold: 5
initialDelaySeconds: 90
periodSeconds: 10
successThreshold: 1
timeoutSeconds: 5
nodeAffinityPreset:
key: ''
type: ''
values: []
nodeSelector: {}
podAffinityPreset: ''
podAnnotations: {}
podAntiAffinityPreset: ''
podLabels: {}
priorityClassName: ''
readinessProbe:
enabled: true
failureThreshold: 5
initialDelaySeconds: 90
periodSeconds: 10
successThreshold: 1
timeoutSeconds: 5
replicas: 1
resources:
limits: {}
requests:
cpu: 25m
memory: 256Mi
schedulerName: ''
securityContext:
enabled: true
fsGroup: 1001
runAsUser: 1001
service:
annotations: {}
loadBalancerIP: ''
nodePort: ''
port: 9200
type: ClusterIP
serviceAccount:
create: false
name: ''
sidecars: []
startupProbe:
enabled: false
failureThreshold: 5
initialDelaySeconds: 90
periodSeconds: 10
successThreshold: 1
timeoutSeconds: 5
tolerations: []
topologySpreadConstraints: []
updateStrategy:
type: RollingUpdate
curator:
affinity: {}
command:
- curator
configMaps:
action_file_yml: |-
---
actions:
1:
action: delete_indices
description: "Clean up ES by deleting old indices"
options:
timeout_override:
continue_if_exception: False
disable_action: False
ignore_empty_list: True
filters:
- filtertype: age
source: name
direction: older
timestring: '%Y.%m.%d'
unit: days
unit_count: 90
field:
stats_result:
epoch:
exclude: False
config_yml: |-
---
client:
hosts:
- {{ template "elasticsearch.coordinating.fullname" . }}.{{ .Release.Namespace }}.svc.{{ .Values.clusterDomain }}
port: {{ .Values.coordinating.service.port }}
# url_prefix:
# use_ssl: True
# certificate:
# client_cert:
# client_key:
# ssl_no_validate: True
# http_auth:
# timeout: 30
# master_only: False
# logging:
# loglevel: INFO
# logfile:
# logformat: default
# blacklist: ['elasticsearch', 'urllib3']
cronjob:
annotations: {}
concurrencyPolicy: ''
failedJobsHistoryLimit: ''
jobRestartPolicy: Never
schedule: 0 1 * * *
successfulJobsHistoryLimit: ''
dryrun: false
enabled: false
env: {}
extraInitContainers: []
extraVolumeMounts: []
extraVolumes: []
hooks:
install: false
upgrade: false
image:
pullPolicy: IfNotPresent
pullSecrets: []
registry: docker.io
repository: bitnami/elasticsearch-curator
tag: 5.8.4-debian-10-r179
initContainers: []
name: curator
nodeAffinityPreset:
key: ''
type: ''
values: []
nodeSelector: {}
podAffinityPreset: ''
podAnnotations: {}
podAntiAffinityPreset: ''
podLabels: {}
priorityClassName: ''
psp:
create: false
rbac:
enabled: false
resources:
limits: {}
requests: {}
schedulerName: ''
serviceAccount:
create: true
name: ''
sidecars: []
tolerations: []
topologySpreadConstraints: []
data:
affinity: {}
autoscaling:
enabled: false
maxReplicas: 3
minReplicas: 1
targetCPU: ''
targetMemory: ''
customLivenessProbe: {}
customReadinessProbe: {}
customStartupProbe: {}
fullnameOverride: ''
heapSize: 2048m
hostAliases: []
initContainers: []
livenessProbe:
enabled: true
failureThreshold: 5
initialDelaySeconds: 90
periodSeconds: 10
successThreshold: 1
timeoutSeconds: 5
name: data
nodeAffinityPreset:
key: ''
type: ''
values: []
nodeSelector: {}
persistence:
accessModes:
- ReadWriteOnce
annotations: {}
enabled: true
existingClaim: ''
existingVolume: ''
selector: {}
size: 8Gi
storageClass: ''
podAffinityPreset: ''
podAnnotations: {}
podAntiAffinityPreset: ''
podLabels: {}
priorityClassName: ''
readinessProbe:
enabled: true
failureThreshold: 5
initialDelaySeconds: 90
periodSeconds: 10
successThreshold: 1
timeoutSeconds: 5
replicas: 1
resources:
limits: {}
requests:
cpu: 25m
memory: 1024Mi
schedulerName: ''
securityContext:
enabled: true
fsGroup: 1001
runAsUser: 1001
serviceAccount:
create: false
name: ''
sidecars: []
startupProbe:
enabled: false
failureThreshold: 5
initialDelaySeconds: 90
periodSeconds: 10
successThreshold: 1
timeoutSeconds: 5
tolerations: []
topologySpreadConstraints: []
updateStrategy:
rollingUpdatePartition: ''
type: RollingUpdate
diagnosticMode:
args:
- infinity
command:
- sleep
enabled: false
extraConfig: {}
extraEnvVars: []
extraEnvVarsConfigMap: ''
extraEnvVarsSecret: ''
extraVolumeMounts: []
extraVolumes: []
fullnameOverride: ''
global:
coordinating:
name: coordinating-only
imagePullSecrets: []
imageRegistry: ''
kibanaEnabled: false
storageClass: ''
image:
debug: false
pullPolicy: IfNotPresent
pullSecrets: []
registry: docker.io
repository: bitnami/elasticsearch
tag: 7.15.2-debian-10-r0
ingest:
affinity: {}
customLivenessProbe: {}
customReadinessProbe: {}
customStartupProbe: {}
enabled: false
fullnameOverride: ''
heapSize: 256m
hostAliases: []
initContainers: []
livenessProbe:
enabled: true
failureThreshold: 5
initialDelaySeconds: 90
periodSeconds: 10
successThreshold: 1
timeoutSeconds: 5
name: ingest
nodeAffinityPreset:
key: ''
type: ''
values: []
nodeSelector: {}
podAffinityPreset: ''
podAnnotations: {}
podAntiAffinityPreset: ''
podLabels: {}
priorityClassName: ''
readinessProbe:
enabled: true
failureThreshold: 5
initialDelaySeconds: 90
periodSeconds: 10
successThreshold: 1
timeoutSeconds: 5
replicas: 1
resources:
limits: {}
requests:
cpu: 25m
memory: 256Mi
schedulerName: ''
securityContext:
enabled: true
fsGroup: 1001
runAsUser: 1001
service:
annotations: {}
loadBalancerIP: ''
nodePort: ''
port: 9300
type: ClusterIP
serviceAccount:
create: false
name: ''
sidecars: []
startupProbe:
enabled: false
failureThreshold: 5
initialDelaySeconds: 90
periodSeconds: 10
successThreshold: 1
timeoutSeconds: 5
tolerations: []
topologySpreadConstraints: []
updateStrategy:
type: RollingUpdate
initScripts: {}
initScriptsCM: ''
initScriptsSecret: ''
kibana:
elasticsearch:
hosts:
- '{{ include "elasticsearch.coordinating.fullname" . }}'
port: 9200
master:
affinity: {}
autoscaling:
enabled: false
maxReplicas: 3
minReplicas: 1
targetCPU: ''
targetMemory: ''
customLivenessProbe: {}
customReadinessProbe: {}
customStartupProbe: {}
fullnameOverride: ''
heapSize: 256m
hostAliases: []
initContainers: []
livenessProbe:
enabled: true
failureThreshold: 5
initialDelaySeconds: 90
periodSeconds: 10
successThreshold: 1
timeoutSeconds: 5
name: master
nodeAffinityPreset:
key: ''
type: ''
values: []
nodeSelector: {}
persistence:
accessModes:
- ReadWriteOnce
annotations: {}
enabled: true
existingClaim: ''
existingVolume: ''
selector: {}
size: 8Gi
storageClass: ''
podAffinityPreset: ''
podAnnotations: {}
podAntiAffinityPreset: ''
podLabels: {}
priorityClassName: ''
readinessProbe:
enabled: true
failureThreshold: 5
initialDelaySeconds: 90
periodSeconds: 10
successThreshold: 1
timeoutSeconds: 5
replicas: 1
resources:
limits: {}
requests:
cpu: 25m
memory: 1024Mi
schedulerName: ''
securityContext:
enabled: true
fsGroup: 1001
runAsUser: 1001
service:
annotations: {}
loadBalancerIP: ''
nodePort: ''
port: 9300
type: ClusterIP
serviceAccount:
create: false
name: ''
sidecars: []
startupProbe:
enabled: false
failureThreshold: 5
initialDelaySeconds: 90
periodSeconds: 10
successThreshold: 1
timeoutSeconds: 5
tolerations: []
topologySpreadConstraints: []
updateStrategy:
type: RollingUpdate
metrics:
affinity: {}
enabled: false
extraArgs: []
hostAliases: []
image:
pullPolicy: IfNotPresent
pullSecrets: []
registry: docker.io
repository: bitnami/elasticsearch-exporter
tag: 1.3.0-debian-10-r19
livenessProbe:
enabled: true
failureThreshold: 5
initialDelaySeconds: 60
periodSeconds: 10
successThreshold: 1
timeoutSeconds: 5
name: metrics
nodeAffinityPreset:
key: ''
type: ''
values: []
nodeSelector: {}
podAffinityPreset: ''
podAnnotations:
prometheus.io/port: '9114'
prometheus.io/scrape: 'true'
podAntiAffinityPreset: ''
podLabels: {}
readinessProbe:
enabled: true
failureThreshold: 5
initialDelaySeconds: 5
periodSeconds: 10
successThreshold: 1
timeoutSeconds: 1
resources:
limits: {}
requests: {}
schedulerName: ''
service:
annotations:
prometheus.io/port: '9114'
prometheus.io/scrape: 'true'
type: ClusterIP
serviceMonitor:
enabled: false
interval: ''
namespace: ''
scrapeTimeout: ''
selector: {}
tolerations: []
topologySpreadConstraints: []
name: elastic
nameOverride: ''
plugins: ''
security:
elasticPassword: 'lockitdown'
enabled: true
existingSecret: ''
fipsMode: false
tls:
autoGenerated: true
coordinating:
existingSecret: ''
data:
existingSecret: ''
ingest:
existingSecret: ''
keyPassword: ''
keystoreFilename: elasticsearch.keystore.jks
keystorePassword: ''
master:
existingSecret: ''
restEncryption: true
truststoreFilename: elasticsearch.truststore.jks
truststorePassword: ''
usePemCerts: false
verificationMode: full
snapshotRepoPath: ''
sysctlImage:
enabled: true
pullPolicy: IfNotPresent
pullSecrets: []
registry: docker.io
repository: bitnami/bitnami-shell
resources:
limits: {}
requests: {}
tag: 10-debian-10-r248
volumePermissions:
enabled: false
image:
pullPolicy: IfNotPresent
pullSecrets: []
registry: docker.io
repository: bitnami/bitnami-shell
tag: 10-debian-10-r248
resources:
limits: {}
requests: {}
- Click
Nextand clickInstall. - Verify that everthing is up by running the following command:
kubectl get all -n logging-system
Installing Kibana
Next, we will deploy Kibana to view the logs in Elastic.
- Login to the Rancher Interface.
- Go to
Apps and Marketplace,Charts. - Select only
bitnamifrom the chart repo options. - Click on
kibanamenu item and clickInstall. - Update the following and click
Next:- Namespace:
logging-system - Name:
kibana-logging - Customize Helm options before install:
check
- Namespace:
- Replace all the YAML with the below code:
- Update
kibanaPassword:with the password your used in the Elasticsearch deployment. - Update
ingress.hostname:with the FQDN that you added to DNS for pass through ingress.
- Update
affinity: {}
configuration:
  server:
    basePath: ''
    rewriteBasePath: false
configurationCM: ''
containerPort: 5601
elasticsearch:
  hosts: [elasticsearch-logging-master.logging-system]
  port: 9200
  security:
    auth:
      enabled: true
      existingSecret: ''
      kibanaPassword: 'lockitdown'
      kibanaUsername: elastic
    tls:
      enabled: true
      existingSecret: 'elasticsearch-logging-master-crt'
      passwordsSecret: ''
      truststorePassword: ''
      usePemCerts: true
      verificationMode: certificate
extraConfiguration: {}
extraDeploy: []
extraEnvVars: []
extraEnvVarsCM: ''
extraEnvVarsSecret: ''
extraVolumeMounts: []
extraVolumes: []
forceInitScripts: false
fullnameOverride: ''
global:
  imagePullSecrets: []
  imageRegistry: ''
  storageClass: ''
hostAliases: []
image:
  pullPolicy: IfNotPresent
  pullSecrets: []
  registry: docker.io
  repository: bitnami/kibana
  tag: 7.15.2-debian-10-r0
ingress:
  annotations: {}
  apiVersion: ''
  enabled: true
  extraHosts: []
  extraPaths: []
  extraTls: []
  hostname: kibana.apps.dsodev.net
  path: /
  pathType: ImplementationSpecific
  secrets: []
  tls: true
initContainers: []
initScriptsCM: ''
initScriptsSecret: ''
kubeVersion: ''
livenessProbe:
  enabled: true
  failureThreshold: 6
  initialDelaySeconds: 120
  periodSeconds: 10
  successThreshold: 1
  timeoutSeconds: 5
metrics:
  enabled: false
  service:
    annotations:
      prometheus.io/path: _prometheus/metrics
      prometheus.io/port: '80'
      prometheus.io/scrape: 'true'
  serviceMonitor:
    enabled: false
    interval: ''
    namespace: ''
    scrapeTimeout: ''
    selector: {}
nameOverride: ''
nodeAffinityPreset:
  key: ''
  type: ''
  values: []
nodeSelector: {}
persistence:
  accessMode: ReadWriteOnce
  enabled: true
  existingClaim: ''
  size: 10Gi
  storageClass: ''
plugins: []
podAffinityPreset: ''
podAnnotations: {}
podAntiAffinityPreset: soft
podLabels: {}
readinessProbe:
  enabled: true
  failureThreshold: 6
  initialDelaySeconds: 30
  periodSeconds: 10
  successThreshold: 1
  timeoutSeconds: 5
replicaCount: 1
resources:
  limits: {}
  requests: {}
savedObjects:
  configmap: ''
  urls: []
schedulerName: ''
securityContext:
  enabled: true
  fsGroup: 1001
  runAsNonRoot: true
  runAsUser: 1001
service:
  annotations: {}
  externalTrafficPolicy: Cluster
  extraPorts: []
  labels: {}
  loadBalancerIP: ''
  nodePort: ''
  port: 5601
  type: ClusterIP
serviceAccount:
  annotations: {}
  create: true
  name: ''
sidecars: []
tls:
  autoGenerated: false
  enabled: false
  existingSecret: ''
  keyPassword: ''
  keystorePassword: ''
  passwordsSecret: ''
  usePemCerts: false
tolerations: []
updateStrategy:
  type: RollingUpdate
volumePermissions:
  enabled: false
  image:
    pullPolicy: IfNotPresent
    pullSecrets: []
    registry: docker.io
    repository: bitnami/bitnami-shell
    tag: 10-debian-10-r248
  resources: {}
- Click
Nextand clickInstall. - Verify that everthing is up by running the following command:
kubectl get all -n logging-system
Installing Fluent-bit
Next we will install Fluent-bit to actually ship the logs out of Kubernetes and into Elasticsearch.
- Login to the Rancher Interface.
- Go to
Apps and Marketplace,Repositories. - Click
Createand add the following then clickCreateagain:
- Name:
fluent - Target:
Git - Git Repo URL:
https://github.com/fluent/helm-charts - Git Branch:
main
- Click on
fluent-bitmenu item and clickInstall. - Update the following and click
Next:- Namespace:
logging-system - Name:
fluentbit-logging - Customize Helm options before install:
check
- Namespace:
- Replace all the YAML with the below code.
- Update
HTTP_Passwdwith the password your used in the Elasticsearch deployment.
- Update
# Default values for fluent-bit.

# kind -- DaemonSet or Deployment
kind: DaemonSet

# replicaCount -- Only applicable if kind=Deployment
replicaCount: 1

image:
  repository: fluent/fluent-bit
  # Overrides the image tag whose default is {{ .Chart.AppVersion }}
  tag: ""
  pullPolicy: Always

testFramework:
  image:
    repository: busybox
    pullPolicy: Always
    tag: latest

imagePullSecrets: []
nameOverride: ""
fullnameOverride: ""

serviceAccount:
  create: true
  annotations: {}
  name:

rbac:
  create: true
  nodeAccess: false

podSecurityPolicy:
  create: false
  annotations: {}

podSecurityContext: {}
#   fsGroup: 2000

hostNetwork: false
dnsPolicy: ClusterFirst

dnsConfig: {}
#   nameservers:
#     - 1.2.3.4
#   searches:
#     - ns1.svc.cluster-domain.example
#     - my.dns.search.suffix
#   options:
#     - name: ndots
#       value: "2"
#     - name: edns0

hostAliases: []
#   - ip: "1.2.3.4"
#     hostnames:
#     - "foo.local"
#     - "bar.local"

securityContext: {}
#   capabilities:
#     drop:
#     - ALL
#   readOnlyRootFilesystem: true
#   runAsNonRoot: true
#   runAsUser: 1000

service:
  type: ClusterIP
  port: 2020
  labels: {}
  # nodePort: 30020
  annotations: {}
#   prometheus.io/path: "/api/v1/metrics/prometheus"
#   prometheus.io/port: "2020"
#   prometheus.io/scrape: "true"

serviceMonitor:
  enabled: false
#   namespace: monitoring
#   interval: 10s
#   scrapeTimeout: 10s
#   jobLabel: fluentbit
#   selector:
#    prometheus: my-prometheus
#  ## metric relabel configs to apply to samples before ingestion.
#  ##
#  metricRelabelings:
#    - sourceLabels: [__meta_kubernetes_service_label_cluster]
#      targetLabel: cluster
#      regex: (.*)
#      replacement: ${1}
#      action: replace
#  ## relabel configs to apply to samples after ingestion.
#  ##
#  relabelings:
#    - sourceLabels: [__meta_kubernetes_pod_node_name]
#      separator: ;
#      regex: ^(.*)$
#      targetLabel: nodename
#      replacement: $1
#      action: replace

prometheusRule:
  enabled: false
#   namespace: ""
#   additionnalLabels: {}
#   rules:
#   - alert: NoOutputBytesProcessed
#     expr: rate(fluentbit_output_proc_bytes_total[5m]) == 0
#     annotations:
#       message: |
#         Fluent Bit instance {{ $labels.instance }}'s output plugin {{ $labels.name }} has not processed any
#         bytes for at least 15 minutes.
#       summary: No Output Bytes Processed
#     for: 15m
#     labels:
#       severity: critical

dashboards:
  enabled: false
  labelKey: grafana_dashboard
  annotations: {}

livenessProbe:
  httpGet:
    path: /
    port: http

readinessProbe:
  httpGet:
    path: /api/v1/health
    port: http

resources: {}
#   limits:
#     cpu: 100m
#     memory: 128Mi
#   requests:
#     cpu: 100m
#     memory: 128Mi

nodeSelector: {}

tolerations: []

affinity: {}

labels: {}

annotations: {}

podAnnotations: {}

podLabels: {}

priorityClassName: ""

env: []

envFrom: []

extraContainers: []
#   - name: do-something
#     image: busybox
#     command: ['do', 'something']

extraPorts: []
#   - port: 5170
#     containerPort: 5170
#     protocol: TCP
#     name: tcp
#     nodePort: 30517

extraVolumes: []

extraVolumeMounts: []

updateStrategy: {}
#   type: RollingUpdate
#   rollingUpdate:
#     maxUnavailable: 1

# Make use of a pre-defined configmap instead of the one templated here
existingConfigMap: ""

networkPolicy:
  enabled: false
#   ingress:
#     from: []

luaScripts: {}

## https://docs.fluentbit.io/manual/administration/configuring-fluent-bit/configuration-file
config:
  service: |
    [SERVICE]
        Daemon Off
        Flush 1
        Log_Level {{ .Values.logLevel }}
        Parsers_File parsers.conf
        Parsers_File custom_parsers.conf
        HTTP_Server On
        HTTP_Listen 0.0.0.0
        HTTP_Port {{ .Values.service.port }}
        Health_Check On

  ## https://docs.fluentbit.io/manual/pipeline/inputs
  inputs: |
    [INPUT]
        Name tail
        Path /var/log/containers/*.log
        multiline.parser docker, cri
        Tag kube.*
        Mem_Buf_Limit 5MB
        Skip_Long_Lines On

    [INPUT]
        Name systemd
        Tag host.*
        Systemd_Filter _SYSTEMD_UNIT=kubelet.service
        Read_From_Tail On

  ## https://docs.fluentbit.io/manual/pipeline/filters
  filters: |
    [FILTER]
        Name kubernetes
        Match kube.*
        Merge_Log On
        Keep_Log Off
        K8S-Logging.Parser On
        K8S-Logging.Exclude On

  ## https://docs.fluentbit.io/manual/pipeline/outputs
  outputs: |
    [OUTPUT]
        Name es
        Match kube.*
        Host elasticsearch-logging-master.logging-system
        Logstash_Format On
        Retry_Limit 2
        Generate_ID On
        Replace_Dots On
        Trace_Error On
        HTTP_User elastic
        HTTP_Passwd lockitdown
        tls on
        tls.verify off

    [OUTPUT]
        Name es
        Match host.*
        Host elasticsearch-logging-master.logging-system
        Logstash_Format On
        Logstash_Prefix node
        Retry_Limit 2
        Generate_ID On
        Replace_Dots On
        Trace_Error On
        HTTP_User elastic
        HTTP_Passwd lockitdown
        tls on
        tls.verify off

  ## https://docs.fluentbit.io/manual/pipeline/parsers
  customParsers: |
    [PARSER]
        Name docker_no_time
        Format json
        Time_Keep Off
        Time_Key time
        Time_Format %Y-%m-%dT%H:%M:%S.%L

  # This allows adding more files with arbitary filenames to /fluent-bit/etc by providing key/value pairs.
  # The key becomes the filename, the value becomes the file content.
  extraFiles: {}
#     example.conf: |
#       [OUTPUT]
#           Name example
#           Match foo.*
#           Host bar

# The config volume is mounted by default, either to the existingConfigMap value, or the default of "fluent-bit.fullname"
volumeMounts:
  - name: config
    mountPath: /fluent-bit/etc/fluent-bit.conf
    subPath: fluent-bit.conf
  - name: config
    mountPath: /fluent-bit/etc/custom_parsers.conf
    subPath: custom_parsers.conf

daemonSetVolumes:
  - name: varlog
    hostPath:
      path: /var/log
  - name: varlibdockercontainers
    hostPath:
      path: /var/lib/docker/containers
  - name: etcmachineid
    hostPath:
      path: /etc/machine-id
      type: File

daemonSetVolumeMounts:
  - name: varlog
    mountPath: /var/log
  - name: varlibdockercontainers
    mountPath: /var/lib/docker/containers
    readOnly: true
  - name: etcmachineid
    mountPath: /etc/machine-id
    readOnly: true

args: []

command: []

# This supports either a structured array or a templatable string
initContainers: []

# Array mode
# initContainers:
#   - name: do-something
#     image: bitnami/kubectl:1.22
#     command: ['kubectl', 'version']

# String mode
# initContainers: |-
#   - name: do-something
#     image: bitnami/kubectl:{{ .Capabilities.KubeVersion.Major }}.{{ .Capabilities.KubeVersion.Minor }}
#     command: ['kubectl', 'version']

logLevel: info
- Click
Nextand clickInstall. - Verify that everthing is up by running the following command:
kubectl get all -n logging-system
Accessing Logs With Kibana
Lastly, we need to login to Kibana, add the search index pattern, and start viewing the logs.
- In a browser, navigate to the FQDN you defined for your Kibana instance. eg:
https://kibana.apps.dsodev.net. - Login using:
- Username:
elastic - Password: the password your used in the Elasticsearch deployment.
- Username:
- Click the burger menu in the upper left and select
Stack Managementat the bottom. - Under
Kibana, selectIndex Patterns. - Click
Create Index Pattern. - Enter the following details and click
Create Index Pattern:- Name:
logstash* - Timestamp:
@timestamp
- Name:
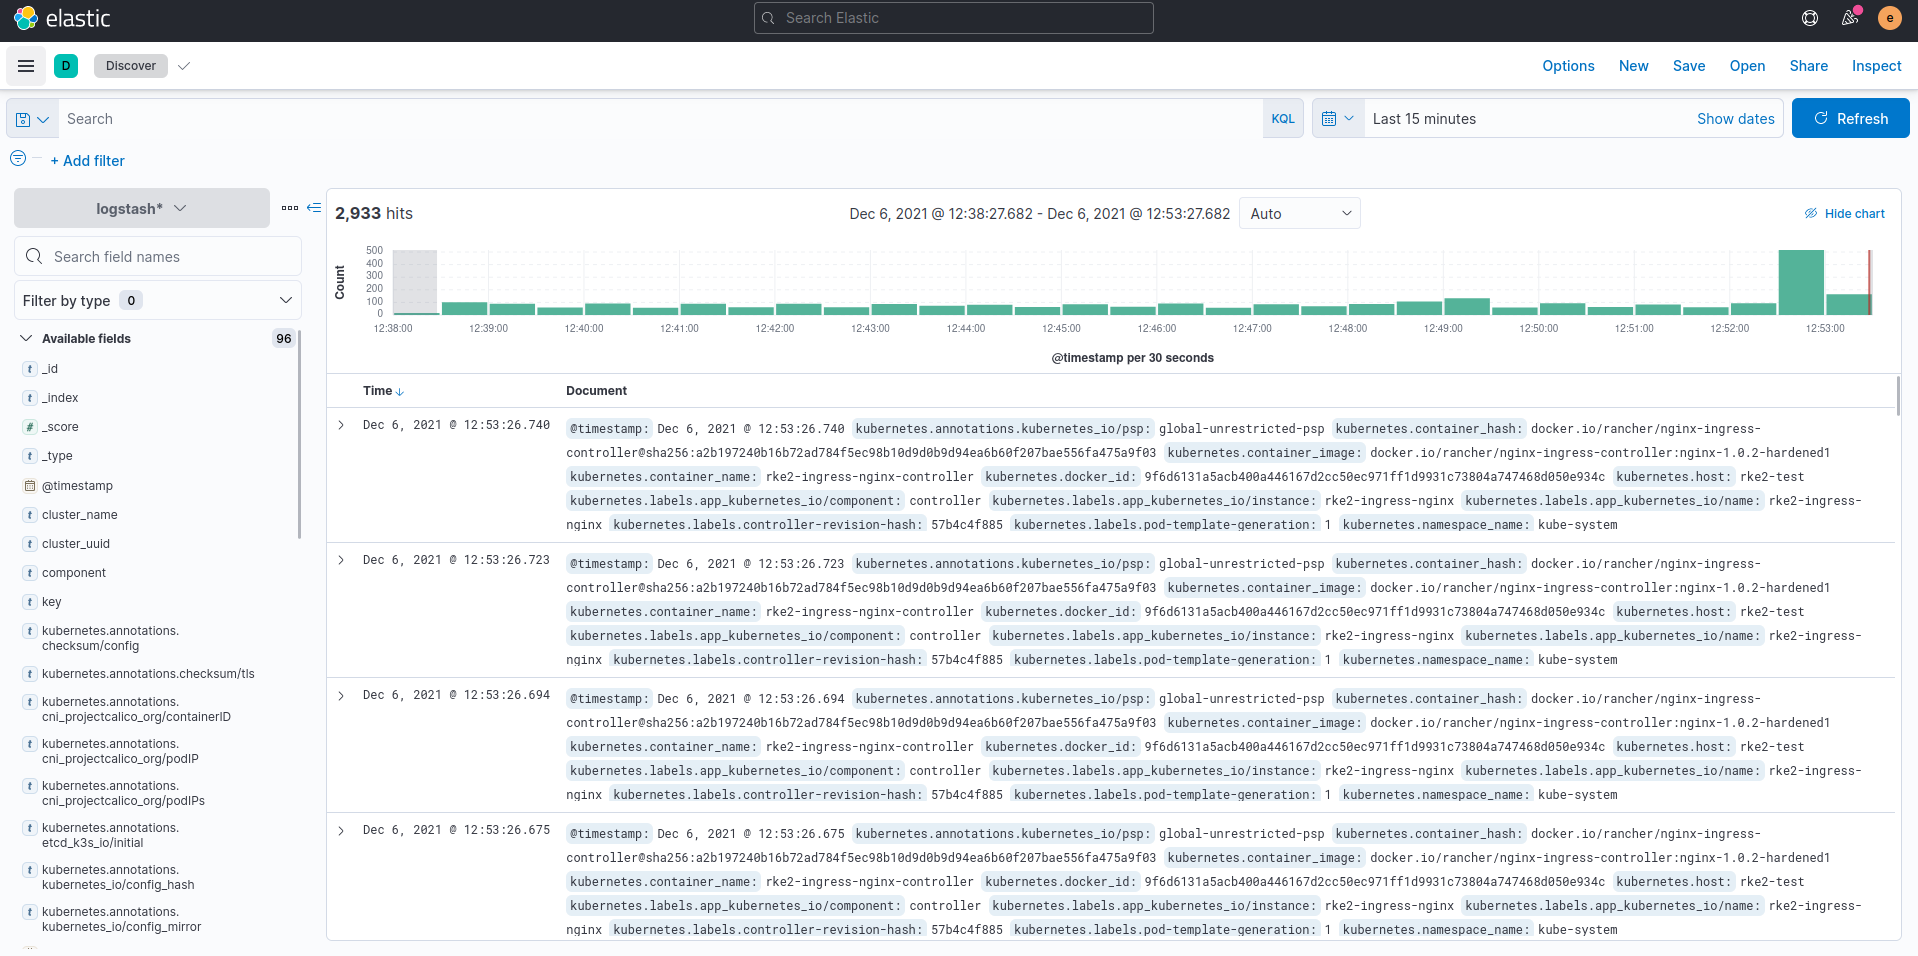
- Click the burger menu in the upper left and select
Discover. - You should see logs from all pods in your cluster flowing into this interface.
Closing
Based on the instructions in the “Single Node RKE2” blogs, you should now have a solid foundation cluster for running, monitoring, and logging workloads on Kubernetes.
Deploying RKE2 or K3s as a highly available, multi-node, production-ready setup involves quite a few more steps. But this guide hopefully gives you the starting point and confidence to go start building that out for yourself or your organization.
If you have any questions or would like AlphaBravo’s assistance in building production-grade Kubernetes clusters, please reach out to us at info@alphabravo.io.
Thanks for reading!
The AB Engineering Team
Website: https://alphabravo.io
Contact Us: https://alphabravo.io/contact-us